
Helping Sustain our Village Community + Working Creatively to Tackle the Challenge of Climate Change
The History of Ilmington - Chapter 10
Size and structure of the community in the 19th and 20th centuries
Until the early years of the present century Ilmington had a community of people whose livelihood was based on agriculture, with a minority practising village-based crafts. To serve the community there was a number of retail traders. The later must have been of great importance when the only means of transport for the majority was the carrier's cart.
Today, though the land is still farmed, the majority of the community works outside the village and there is a large group of retired people. Only one retail shop and the post office survive. Village-based crafts are represented by three builders, the garage proprietor, and a versatile hurdle maker. Another change is in the proportion of children at school.
This chapter is an endeavour to give numerical expression to these changes and to present the results in the form of diagrams, graphs and tables. The explanation of the means by which the figures have been obtained, and the reasons for the choice of groups to be shown follows.
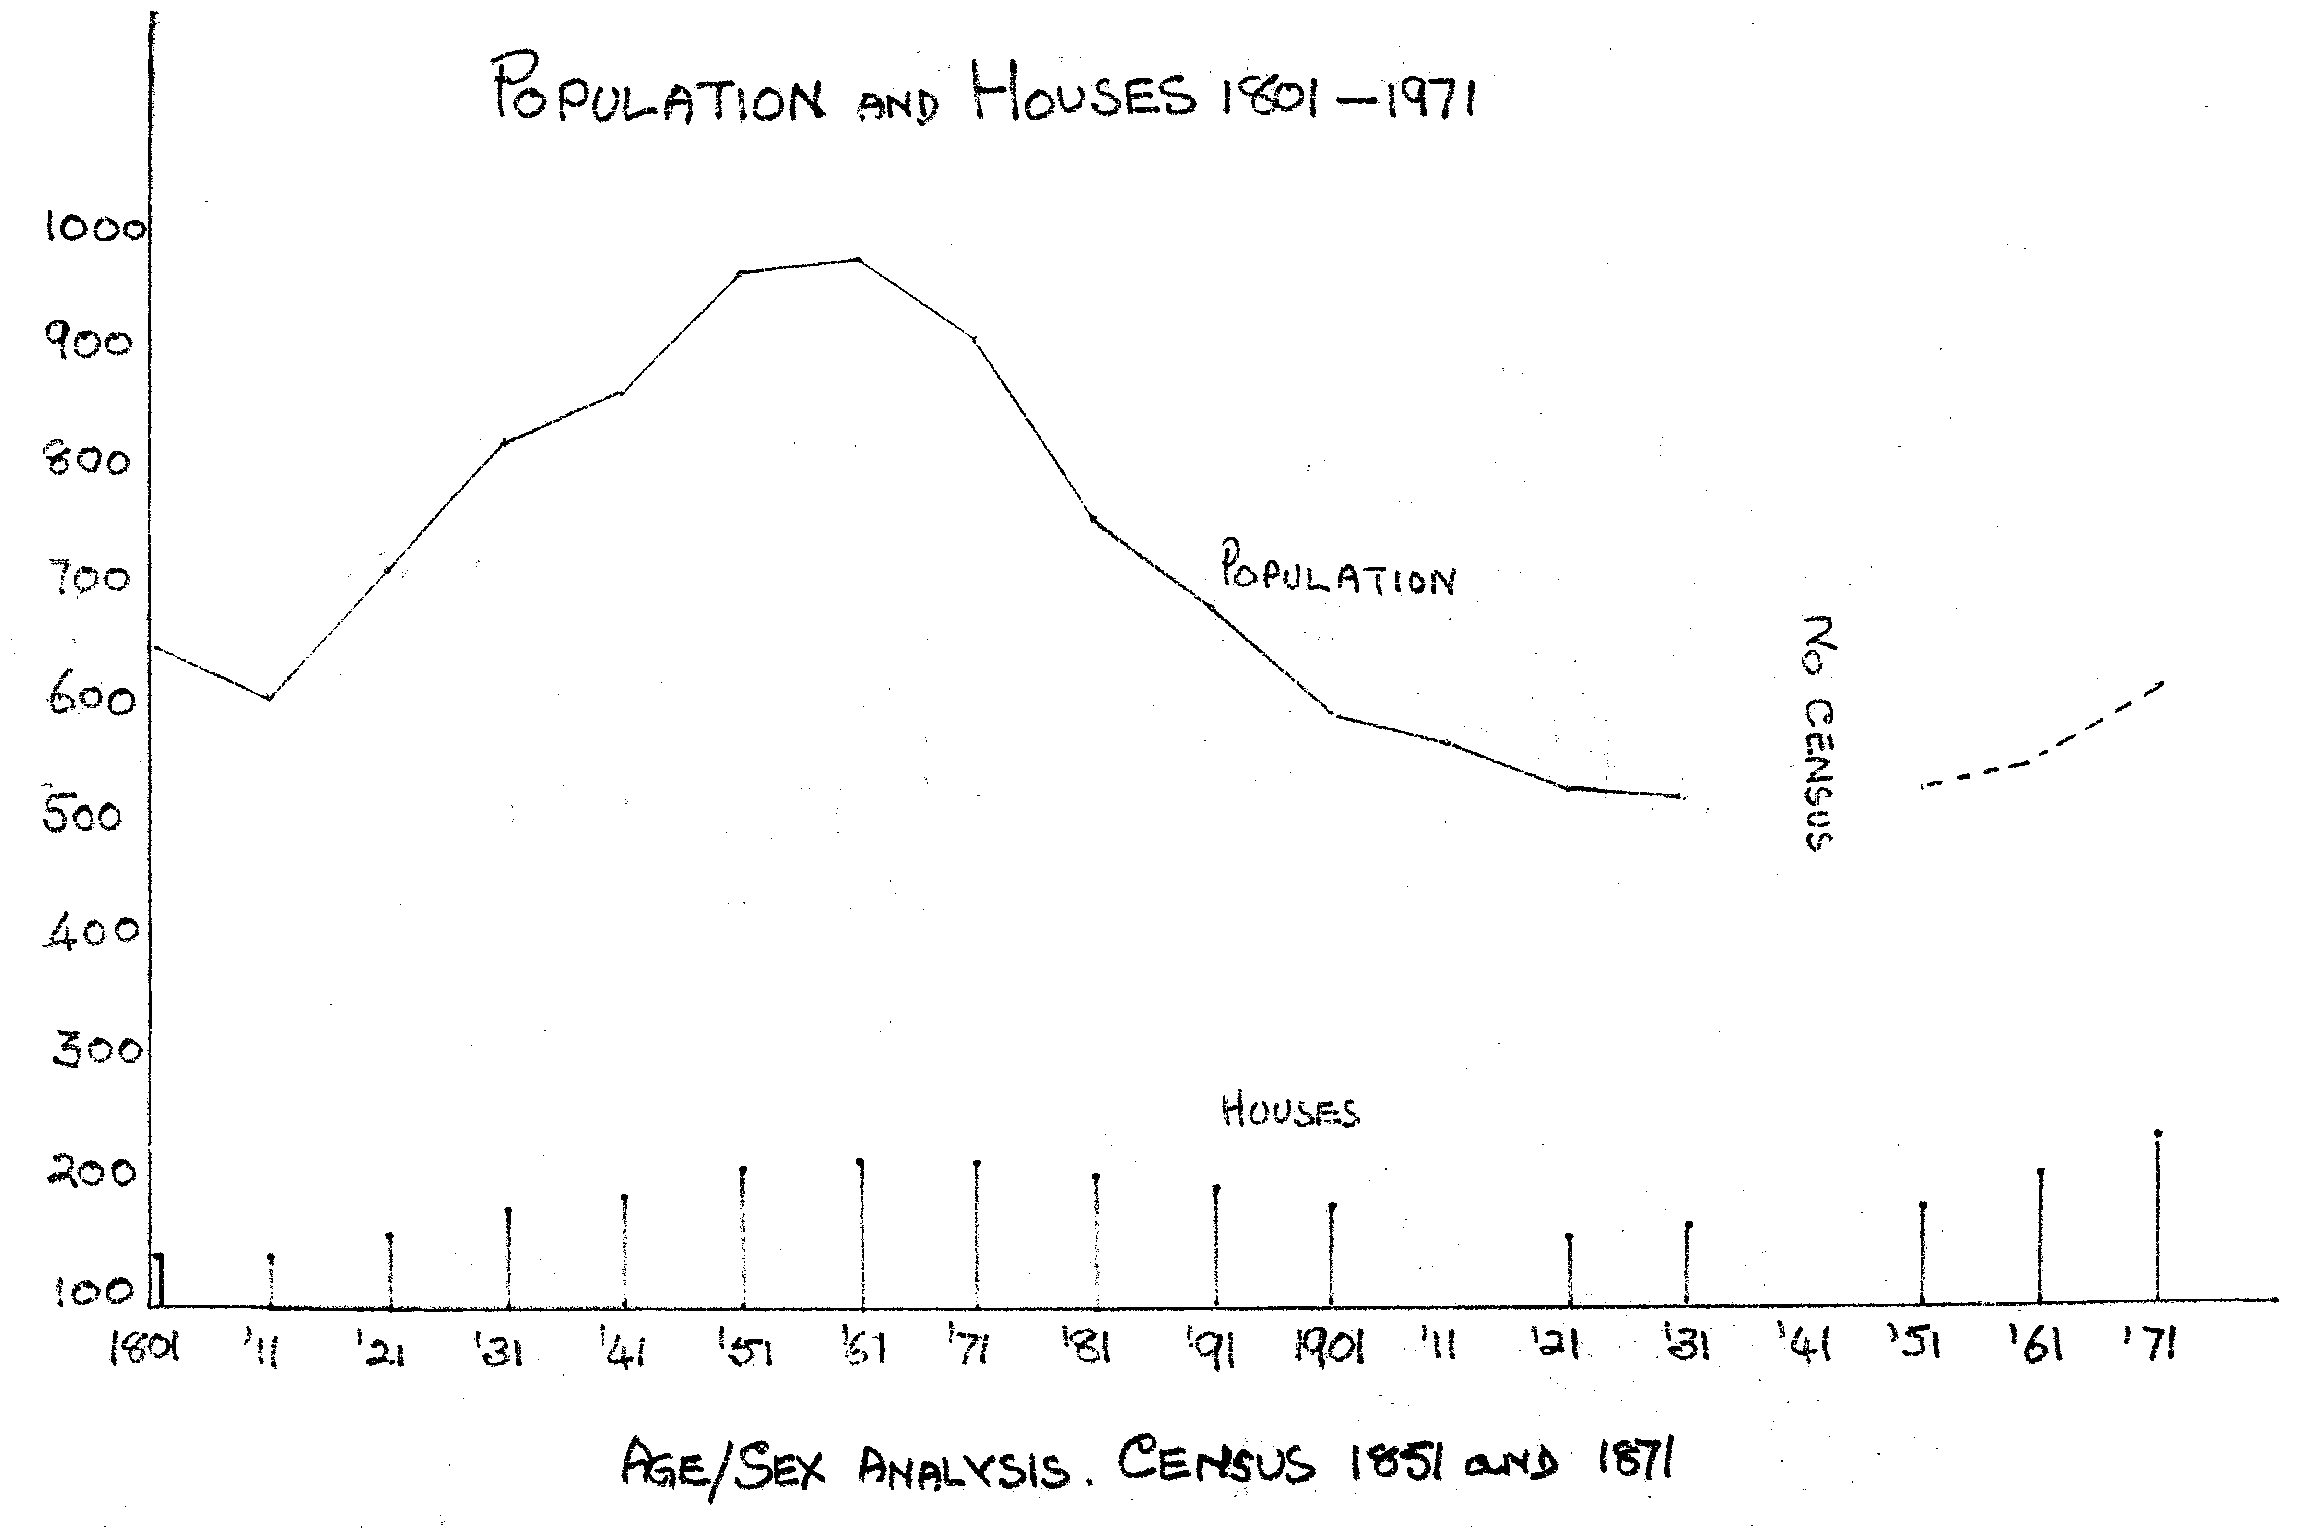
The figures for population and number of houses have been taken from the printed census reports for 1801 to 1951. Those for 1961 and 1971 have been obtained from Shipston Rural District Council, or compiled as the result of enquiry.
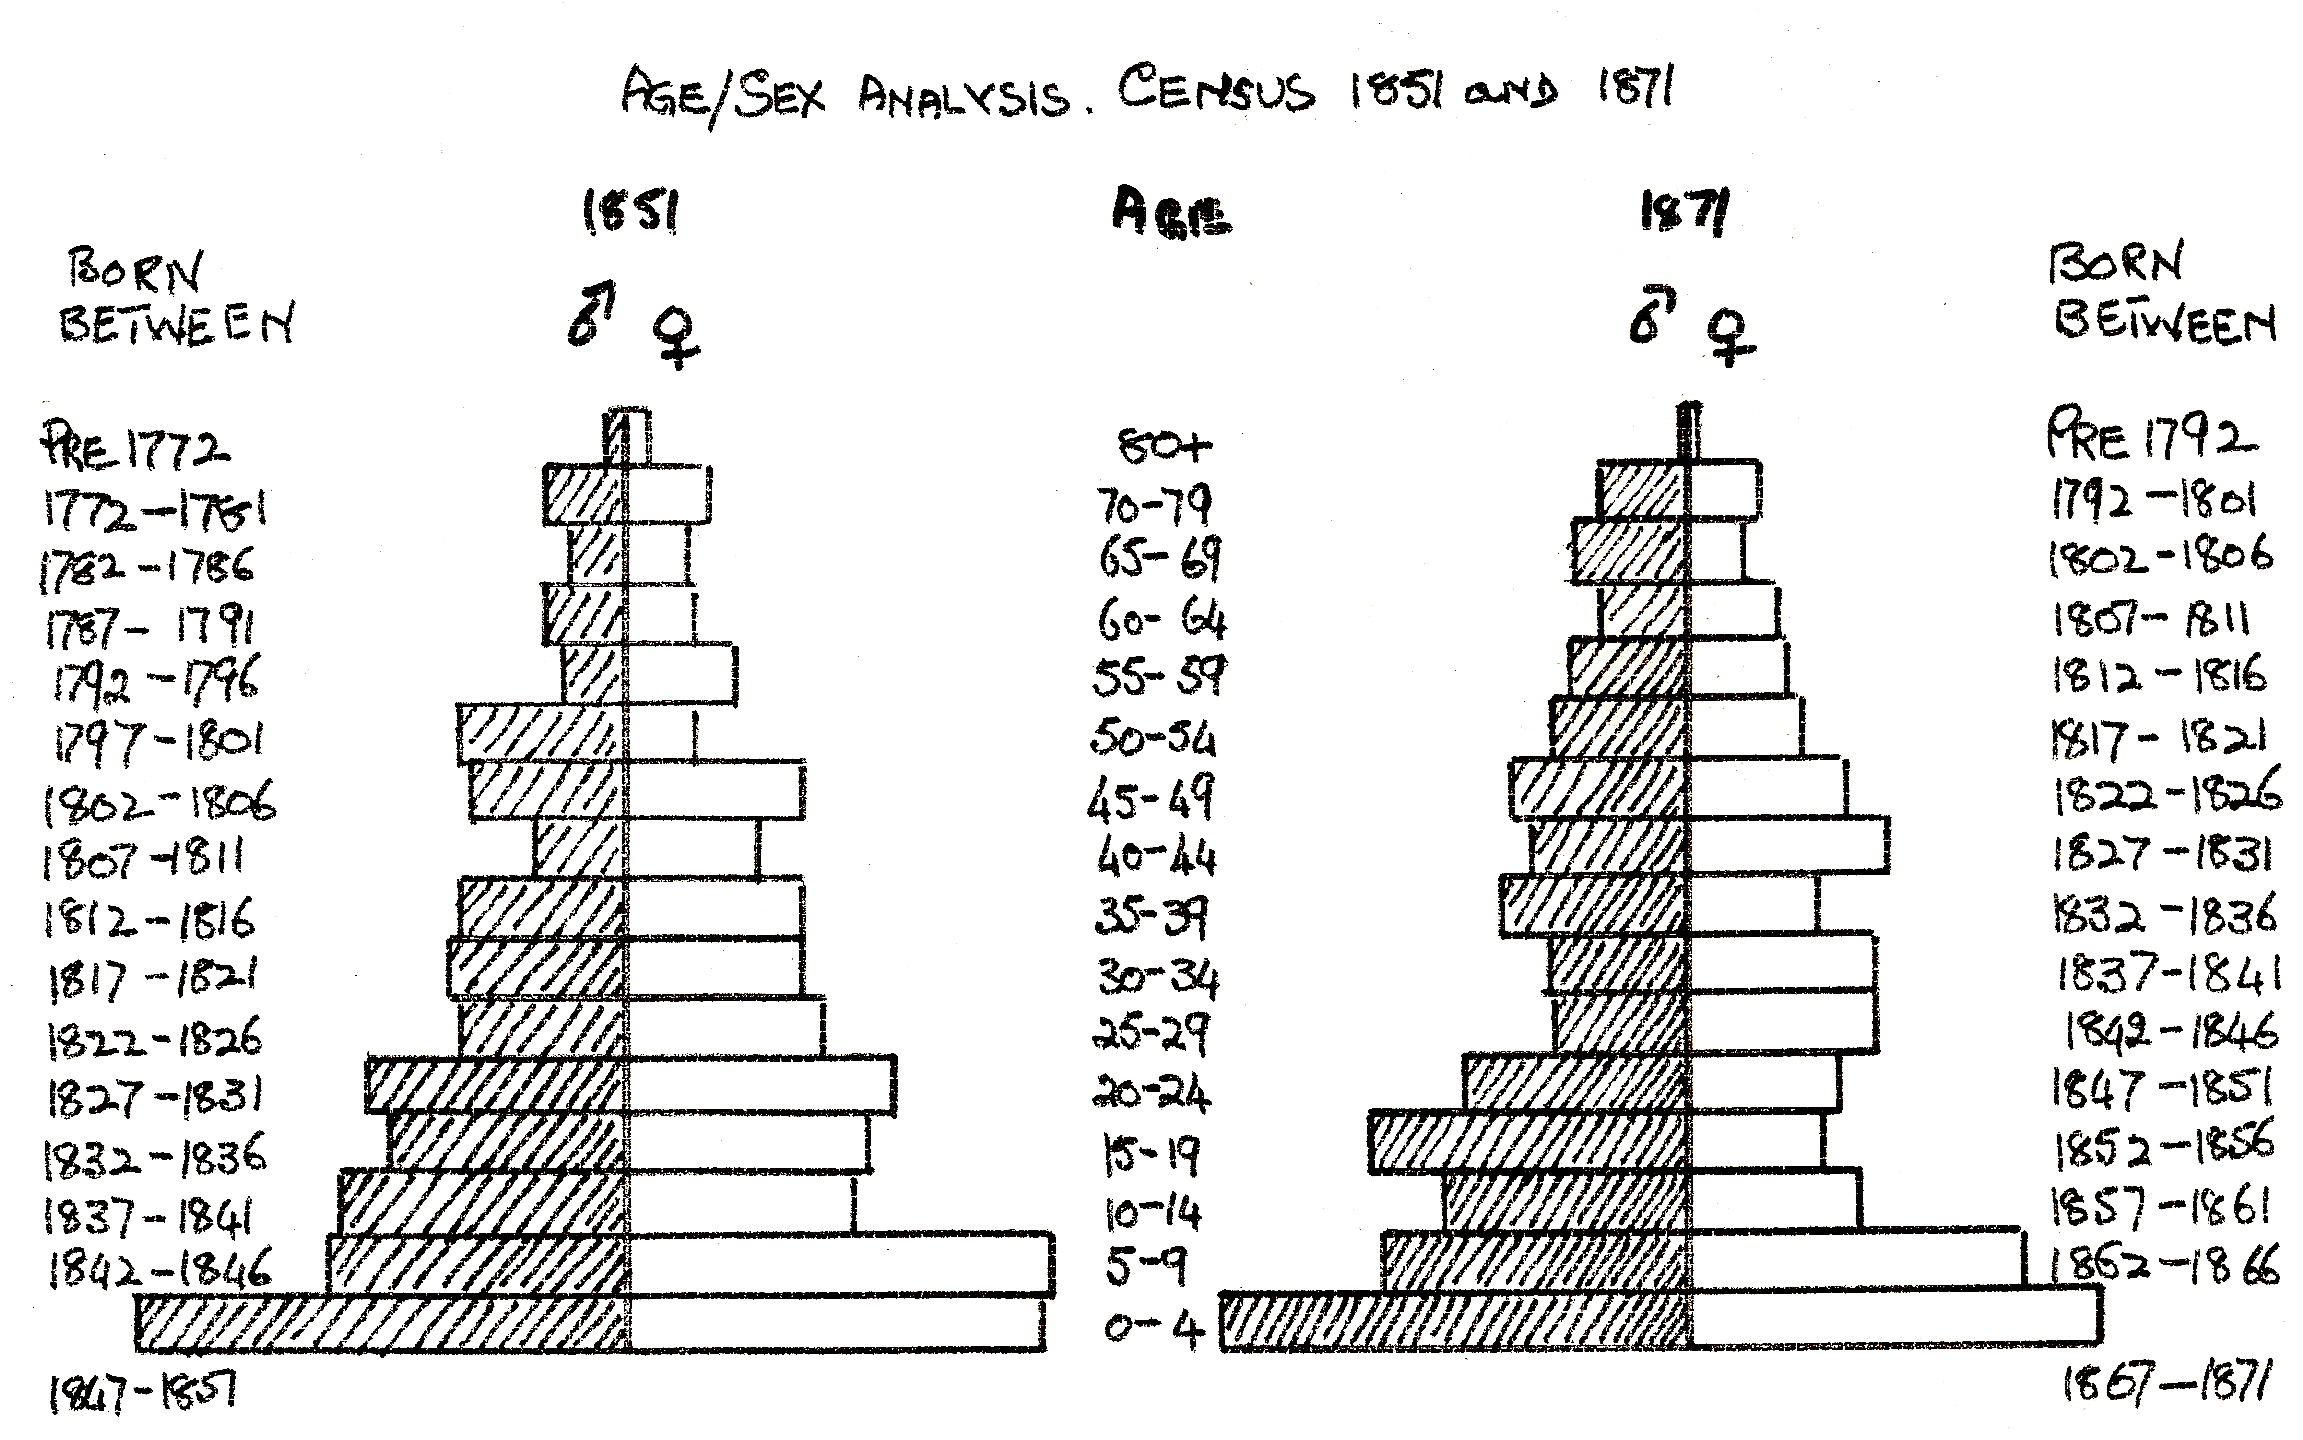
The selection of groups to show the structure of the community was governed partly by the size of the group and partly by the data which could be obtained for the present day by a reasonable amount of enquiry but without the use of a questionnaire. To obtain valid comparisons it was necessary to subdivide the children into those below the age of three who were not at any time officially accepted at school, and those between the ages of 3 and 15 who, in the 19th century might be at school, at home or employed. Even then it has been necessary to extend the group of children for the 1971 diagram to the age of 18 for two reasons. Many of the 15-18 year olds are at school and the population figure was compiled from the electoral register of those over 18, with the addition of the number of children obtained by enquiry at the local infant and junior school, from the Health Authority for those under 5, and other individual enquiries for those between 11-18 at school, and for a few 15-18 employed. The group therefore on the 1971 diagram of children between the ages of 3-18 not at school and not employed are the 3-5 year olds. The group of retired people for 1971 was obtained from the postmistress, who kindly gave the numbers (but not names) of people drawing the national pension. To this was added a small number for those likely to have it paid to a bank. For 1851 and 1871 this group is composed of elderly people to whom the census forms assign no occupation. The unshaded parts of all three diagrams include the remainder of the community not included in the chosen groups.
The census for 1851 is the first to give both place of birth and occupation, that for 1871 is the last at present available, and it was for these reasons that these census forms were chosen for analysis. They also lie on either side of Ilmington's peak population in 1861.
Included among the craftsmen shown in the diagrams for 1851 and 1871 is a considerable number of different crafts, as shown in the following table:-

Traces of two cottage industries are found and are included under 'others'. These are the silk winders, no doubt connected with the Blockley silk industry. They are found in the 1851 census but not in 1871. The others are the gloveresses found in both.
Other crafts represented were that of hooper and cooper. In the early 20th century the hoopers were making hoops for Manchester cotton bales according to 'Shepherd's Pie' by Father Ingram. Whether this was so in the earlier years is not known. The cooper not only made large barrels but cut down old ones to make small barrels carried to the harvest field.
In the 1871 census were mentioned two owners of threshing machines and six agricultural machinists. For a time there were two wheelwrights, one of whom continued into the 20th century. There were also two timber dealers. From information contained in the minutes of the parish council, it seems that one of these stored his timber and even had a sawing pit on the lower green. At a later date the sawing pits were behind the cottages in Middle Street.
There were also tailors, dressmakers and shoemakers. There was a variety of retailers including a linen draper, among them accounting for eighteen people in 1851 and sixteen in 1871.
In both, 1851 and 1871, there is a marked discrepancy between the numbers designated as agricultural laborers and the number of laborers the farmers claim to employ. In 1851, 72 out of a total of 163, and in 1871, 84 out of a total of 192, appear to be casual laborers. They may, of course, have had steady employment outside Ilmington. If this was not so there must have been a considerable amount of distress at certain times of the year.
The population graph shows a rapid increase up to 1861 after which there is a dramatic fall so that by 1910 the community was little more than half the size it had been in 1861. This is no doubt a pattern common to other villages of the district. To find a reason for the decline after 1861 the change in size of the population was compared with the number of burials decade by decade. The highest number of burials occurred between 1841/51 when the community was still increasing in size, and for 1871/81 the number of burials was below the decrease in size of the community. Changes would therefore appear to be in the first case due to people entering the village and in the second to more people leaving. Evidence for the latter is given later.
Analysis of the 1851 and 1871 returns showed that at each date approximately one third of the people had not been born in the village. Of these many came for family reasons.

Of the remainder, apart from children the following data was determined:-

With the annual hiring fairs some change would be expected and it has not been determined how many of the 1851 immigrants were still present in 1871.
A fact worth noting, and dealt with more fully in chapter 12, is that the number of houses occupied in 1972 by a population a little over 600 is approximately the same as for the population of nearly 1000 in 1861.
In Joseph Ashby's study of conditions in some south Warwickshire villages in the later years of the 19th century (1), he gives as a reason for young people leaving the villages the inadequacies of cottage accommodation. For some of the years of the 19th and early 20th centuries the printed census reports give information on the numbers of families, houses occupied, empty, and being built. These figures are tabulated below. Where no figure is given, there appears to be no information and the council building which took place in the 20th century does not appear in these reports.

Without more knowledge it is not safe to comment but these figures at least suggest both overcrowding and dereliction of many old cottages.
If the census figures for houses and number of families are correct there is an astonishing growth of overcrowding or multiple occupation (not necessarily the same) between 1801-1811-1821 after which the data is intermittent.
A considerable amount of building is suggested though not recorded between 1811-21, 18 houses - 1821-31, 22 houses.
Finally from the rector's address at the opening of the school building in 1858 quoted in chapter 13 it seems likely that the census figures of 1851 for children at school are too high.

1. Economic Journal, March & June 1893.